Ecosystem
Grafana Cloud vs Datadog vs Honeycomb: which AWS observability tool in 2026
CloudWatch, Grafana Cloud, Datadog, Honeycomb: four radically different pricing models for the same need. A numbers-first comparison for an AWS organization choosing in 2026.
An organization starting out on AWS runs on CloudWatch by default — it’s native, on by day one, billed on usage. The moment the “do we need a third-party observability tool” question actually gets asked almost always happens in the same place: a production incident where the first hour goes into cross-referencing three consoles (CloudWatch Logs, CloudWatch Metrics, X-Ray) to reconstruct what happened, when a single screen should have sufficed. Three third-party tools keep coming up in that conversation — Grafana Cloud, Datadog, and Honeycomb — with three philosophies and three pricing models that have almost nothing in common.
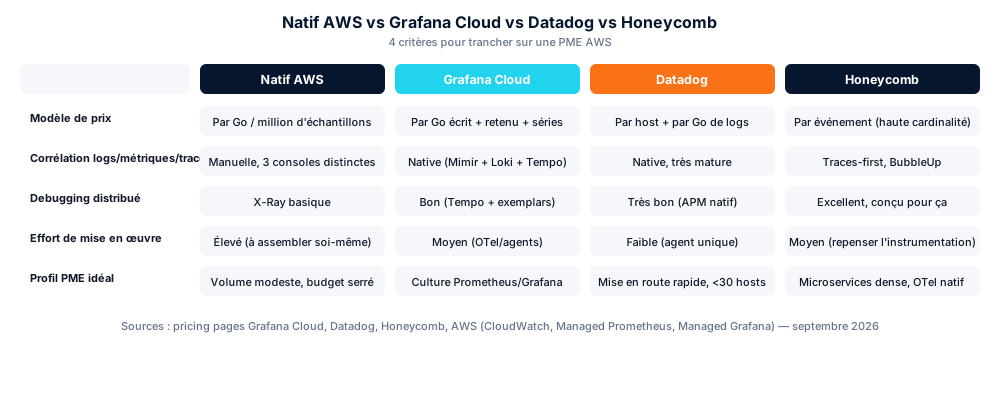
This article compares all four options (AWS-native included) on concrete criteria: what each one actually charges in 2026, what it correlates natively, and which organization profile it fits. It complements our article on cutting a spiraling Datadog bill — here the question comes upstream: should you pay a third party at all, and which one, before you even have a bill problem.
The AWS-native baseline: CloudWatch, Managed Prometheus, Managed Grafana
Three free or near-free AWS building blocks cover most of the need before a third party is worth considering:
- CloudWatch Logs: ingestion at $0.50/GB on the Standard class, or $0.25/GB on Infrequent Access (full Logs Insights support since early 2026) — then $0.03/GB/month for archive storage.
- CloudWatch Container Insights for EKS: in enhanced-observability mode, $0.21 per million observations, tiered down past one billion per month.
- Amazon Managed Service for Prometheus (AMP): $0.09 per million samples ingested on the first 2 billion per month, $0.0001 per million samples queried, $0.03/GB/month stored — Prometheus-API-compatible, so migrating away doesn’t mean rewriting PromQL queries.
- Amazon Managed Grafana (AMG): $9/editor/month and $5/viewer/month, 90-day free trial with 5 users — a visualization front end only, not a storage backend.
The AMP + AMG + CloudWatch combination covers dashboards, alerting, and retention at a low cost as long as volume stays modest. The structural limit isn’t price — it’s the lack of native correlation. CloudWatch Logs, CloudWatch Metrics, and X-Ray remain three separate products with three separate consoles — going from a latency alert to the log line to the trace that explains it takes manual plumbing (or heavy tagging discipline) that the three third-party tools below industrialize natively.
Grafana Cloud: the open-source stack, billed on usage
Grafana Cloud is built on its own open-source stack — Mimir (metrics, Prometheus-compatible), Loki (logs), Tempo (traces) — hosted and managed, with a granular usage-based pricing model rather than tiered pricing:
| Component | Pro rate (beyond free tier) |
|---|---|
| Metrics | $6.50 / 1,000 active series/month |
| Logs, traces, profiles | $0.40/GB write + $0.05/GB process + $0.10/GB/month retention |
| Platform fee | $19/month (Pro) |
| Permanent free tier | 10,000 active series, 50 GB logs, 50 GB traces, 50 GB profiles, 14-day retention |
The strong point for a technical organization: native OpenTelemetry and Prometheus compatibility means existing instrumentation (Prometheus exporters, OTel Collector) plugs in without a rewrite. It’s also the closest thing to a clean exit path — Mimir and Loki are open source, so a move to self-hosted stays realistic if volume ever justifies operating the infra yourself. The trade-off: multi-axis billing (per GB written, per GB retained, per series) is harder to forecast upfront than a per-host price, and demands real metric-cardinality discipline from day one.
Datadog: the all-in-one, predictable by host but wide by default
Datadog remains the simplest option to get a team to adopt without managing a separate instrumentation agent per product:
- Infrastructure Monitoring: $15/host/month (annual commitment), $23/host/month on Enterprise.
- APM: $31/host/month on top of Infrastructure (annual).
- Log Management: $0.10/GB ingested, then standard indexing at $1.70/million events/month (15-day retention, annual) — or long-term Flex storage at $0.05/million events/month for rarely-queried history.
Over 700 ready-made integrations (with very broad AWS coverage — Lambda, RDS, ECS, EKS, API Gateway) and a single console for infra, APM, logs, and RUM explain the widespread adoption. The cost is the classic budget drift documented in our article on cutting a spiraling Datadog bill: the per-host model encourages broad instrumentation, and every product you turn on (APM, logs, RUM, Synthetics) stacks independently. For an organization under 30 hosts that needs to get running fast without much platform-engineering time to spend, it’s often the most cost-effective option despite a higher sticker price — the hidden cost of Grafana Cloud or Honeycomb is the engineering time to assemble the stack.
Honeycomb: betting on high-cardinality tracing
Honeycomb starts from a different premise than the two above: rather than separating logs, metrics, and traces, everything is an “event” — a wide, high-cardinality row, queryable in seconds through its BubbleUp engine, which automatically isolates the dimension responsible for an anomaly (a single request, a single tenant, a single deploy version).
- Free: up to 20 million events/month.
- Pro: starting at $150/month for up to 750 million events/month.
- Pricing tier change effective July 1, 2026: the new Pro rate moves to $3/million events (versus $1.30/million on legacy plans), in exchange for including Time Series Metrics and AI features (Honeycomb Intelligence, Canvas, MCP).
- Enterprise: custom quote, base allowance of 10 billion events/year.
Honeycomb has no infrastructure agent equivalent to Datadog’s, nor as mature a metrics stack as Grafana Cloud pre-2026 — it’s a distributed-debugging tool first, built for teams already instrumenting with OpenTelemetry that have a real tracing problem on a complex microservices architecture. On an organization with a handful of services and modest traffic, the learning investment (the wide-event model requires rethinking instrumentation) rarely pays off — Honeycomb earns its keep once locating a production bug means hours of manual correlation between logs and traces.
A numbers-first simulation for a typical organization profile
Assumptions: 15 EC2/ECS hosts, 40 GB of logs/month, 8,000 active metric series, 20 million traces/spans per month.
| AWS-native | Grafana Cloud | Datadog | Honeycomb | |
|---|---|---|---|---|
| Metrics | AMP: ~$55 | ~$52 (8k series) | Included in per-host price | Included (events) |
| Logs (40 GB) | CloudWatch Standard: ~$20 | ~$18 (write+retain) | Ingestion + indexing: ~$70-100 | Included (events) |
| Infra + APM | AMG: ~$50-90 (licenses) | Platform fee: $19 | 15 hosts infra + APM: ~$690 | — |
| Traces/events | X-Ray: a few $ | Included in logs/traces | Included in APM | ~20M events: near Free/Pro boundary depending on exact volume |
| Rough monthly order of magnitude | ~$150-200 | ~$150-200 | ~$800-900 | $150-300 (Pro) |
These are orders of magnitude, not quotes — they depend heavily on trace sampling rate, chosen retention, and tag/label cardinality. What they show is the structural gap: Datadog charges for breadth of coverage (every host, every product), Grafana Cloud and CloudWatch charge for raw volume, Honeycomb charges per event independent of host count — a profile that becomes very favorable when infrastructure is containerized and dense (few hosts, lots of requests).
OpenTelemetry: the insurance policy against vendor lock-in
The lowest-risk choice long-term isn’t the tool itself but the instrumentation layer upstream. Standardizing on OpenTelemetry (OTel) — SDK instrumentation plus Collector — lets you switch backends without re-instrumenting application code:
receivers:
  otlp:
    protocols:
      grpc:
      http:

exporters:
  otlphttp/grafana_cloud:
    endpoint: "https://otlp-gateway-prod-eu-west-0.grafana.net/otlp"
    auth:
      authenticator: basicauth/grafana_cloud
  datadog:
    api:
      key: ${env:DD_API_KEY}
      site: datadoghq.eu

service:
  pipelines:
    traces:
      receivers: [otlp]
      exporters: [otlphttp/grafana_cloud, datadog]
    metrics:
      receivers: [otlp]
      exporters: [otlphttp/grafana_cloud]
    logs:
      receivers: [otlp]
      exporters: [otlphttp/grafana_cloud]
A Collector configured this way can dual-ship during a genuine comparison phase (not just pricing-page numbers) before you decide, then switch to a single exporter without touching the instrumented code. This is the architecture we consistently recommend, regardless of which backend you end up on.
Our take
Three signals drive the choice on the audits we run:
- Under 20 hosts, small technical team, need to get running in days rather than weeks → Datadog remains the safest default, with a budget that’s predictable on “how many hosts do I have” rather than data volume — as long as you keep an eye on which products get turned on over time (see our guide on the Datadog bill).
- Team with existing Prometheus/Grafana culture, cost sensitivity at scale, appetite for keeping a future self-hosting option open → Grafana Cloud, with real metric-cardinality discipline from day one to avoid the same drift seen elsewhere.
- Dense microservices architecture, a real (not hypothetical) distributed-debugging debt, team already on OpenTelemetry → Honeycomb, paired with CloudWatch or Grafana Cloud for the classic infra monitoring it doesn’t cover natively.
For an organization just starting out, staying on CloudWatch + Managed Prometheus + Managed Grafana holds up far longer than the sales pitches of the three third-party tools suggest — the tipping point is reached when the time lost manually correlating several consoles exceeds, over a quarter, the cost of a subscription. A DevSecOps audit can put a number on that threshold against your actual volume rather than a pricing-page estimate.
Conclusion
There’s no single best observability tool in 2026 — there are four pricing models that reward different usage profiles. CloudWatch and the AWS Managed stack remain the free-or-near-free baseline to leave only for a specific reason. Datadog sells the simplicity of a per-host price at the cost of a breadth of coverage that adds up fast. Grafana Cloud sells open-source compatibility and fine-grained cost control, in exchange for more assembly effort. Honeycomb sells distributed-debugging speed, reserved for organizations with a real, measurable need for it. In every case, instrumenting with OpenTelemetry upstream keeps the decision reversible — which matters more than the initial choice itself.
Sources: Grafana Cloud — pricing, Datadog — pricing, Honeycomb — pricing, Honeycomb — 2026 Pro Plan Changes, AWS — Amazon Managed Service for Prometheus pricing, AWS — Amazon Managed Grafana pricing, AWS — CloudWatch pricing.
Found this useful? Share it.
Go further
A topic, a project, a question?
Distribuée supports demanding SMBs on cloud security, CI/CD supply chain and AI security.
Book 15 min