Ecosystem
Datadog vs CloudWatch on AWS: when to pay for a third party, when to stay native
CloudWatch and Datadog don't bill the same way — per-unit vs per-host. Official pricing, a worked example on a 15-server organization, and the real factor that blows up the bill.
CloudWatch is already there, enabled by default, and already partly paid for — every AWS service pushes its base metrics into it for free. Datadog, on the other hand, is a deliberate install that costs a per-host fee from day one, in exchange for a widely preferred experience: unified dashboards, cross-signal correlation between logs, metrics and traces, finer alerting, and a UI teams consistently rate above the AWS console. The real question isn’t “which one is better” — it’s “at what point does the experience gap justify the cost gap, and which line item actually blows up the bill”.
Short answer: it depends far less on server count than on custom-metric density per host — and that’s close to the opposite of the most common assumption.
Two billing philosophies, not just two prices
CloudWatch bills per unit, brick by brick: per custom metric, per GB of logs ingested, per GB of logs stored, per dashboard, per alarm, per API request. Nothing beyond the free tier is included (10 metrics, 5 GB of logs, 3 dashboards, 10 alarms, 1M API requests per month). Every capability is switched on and billed separately — including the APM equivalent, Application Signals, billed per ingested signal rather than per host.
Datadog bills a flat per-host, per-month fee with a generous included allotment: the Pro plan ($15/host/month on annual commitment, $18 on-demand) includes 100 indexed custom metrics per host. APM is billed on top — either bundled with infrastructure ($35/host/month for APM Pro, infra included) or standalone. Logs are billed separately: $0.10/GB ingested, then $1.70 per million indexed events (the step that actually makes them searchable).
That structural difference — granular usage-based billing vs a flat per-host fee with an allotment — explains why the “winner” depends on your metrics-to-host ratio, not just your server count.
What it actually costs
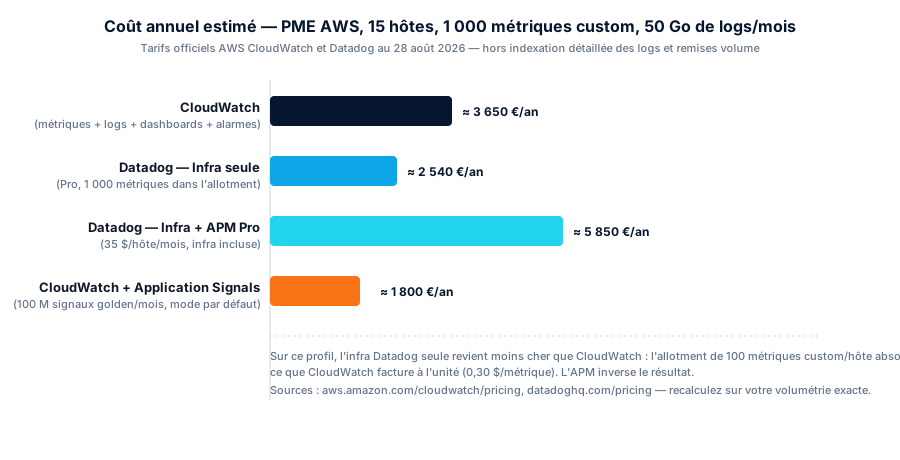
Take a typical B2B SaaS organization profile: 15 hosts (a mix of EC2 and ECS/Fargate tasks counted as hosts), 1,000 application custom metrics, 50 GB of logs/month, around thirty alarms, 5 dashboards.
On CloudWatch (official AWS pricing):
- Custom metrics: 990 billable metrics (beyond the 10 free) × $0.30 = $297/month
- Ingested logs (standard): 45 billable GB × $0.50 = $22.50/month
- Dashboards: 2 paid × $3 = $6/month
- Alarms: 30 billable × $0.10 = $3/month
- Total ≈ $330/month, roughly €300/month — €3,650/year
On Datadog Pro, infrastructure only (no APM), same profile:
- 15 hosts × $15 = $225/month
- Ingested logs: 50 GB × $0.10 = $5/month
- Custom metrics: 1,000 metrics fit within the included allotment (15 × 100 = 1,500) → $0 overage
- Total ≈ $230/month, roughly €210/month — €2,540/year
On this exact profile, Datadog Infrastructure Monitoring alone comes out cheaper than CloudWatch — because the per-host custom-metric allotment absorbs what CloudWatch bills unit by unit. That’s the point most comparisons miss by stopping at “CloudWatch = native = cheaper”.
Add APM ($35/host/month, infra included) and the math flips hard: 15 × $35 + logs ≈ $530/month, roughly €490/month — €5,850/year, nearly twice the cost of CloudWatch + Application Signals on a comparable request volume (100M golden signals/month ≈ $150/month in default mode, before any additional X-Ray tracing).
These figures are order-of-magnitude estimates computed from official AWS and Datadog price lists as of August 28, 2026 — excluding detailed log indexing, data transfer, and negotiated volume discounts. Recompute them against your exact profile before any budget decision.
The real blow-up factor: cardinality, not server count
The trap is almost never the sticker price — it’s how each tool counts a “metric”.
At Datadog, a custom metric is defined by the combination of name and tag values, including the host tag. Adding a customer_id or endpoint tag to an existing metric can multiply its cardinality by the number of distinct values — a team tagging its HTTP metrics by route and by customer can go from 100 to several thousand effective custom metrics without touching the infrastructure at all. Histograms and distributions each count as five custom metrics per combination. And the overage on the indexed allotment — the one that actually feeds your dashboards — has no published rate: Datadog sets it “per your contract”; only the ingestion-side overage is public ($0.10 per 100 metrics/month).
On the CloudWatch side, the mirror-image trap exists in a different form: high-resolution alarms ($0.30/metric/month vs $0.10 standard) and anomaly-detection alarms (billed on 3 underlying metrics, so roughly $0.30/month each) add up fast once every microservice ships its own set of auto-generated alarms. And CloudWatch log indexing stays basic compared to Datadog — there’s no native intelligent tiering equivalent to exclusion filters or Datadog’s Flex Storage ($0.05 per million events stored, outside the active index).
The concrete FinOps lever in both cases: audit tag cardinality before instrumenting, not after the invoice lands. A request_id or session_id tag slapped on a custom metric — Datadog or CloudWatch Embedded Metric Format alike — is the classic move that turns a €300 bill into a €3,000/month bill without a single server being added.
When to stay 100% native CloudWatch
- Single-service or few-microservice stack, low custom-metric density per host (under a hundred).
- Team already comfortable with CloudWatch Logs Insights and native dashboards, without a need for deep cross-signal correlation.
- Priority is strict budget predictability — well-managed unit pricing doesn’t hide contractual surprises.
- No need for complex distributed tracing, or a request volume high enough that Application Signals (billed per signal, not per host) stays structurally cheaper than a per-host APM plan.
- Strictly single-cloud AWS, with no need for unified dashboards across third-party providers.
When Datadog becomes worth it
- High custom-metric density per host (beyond Datadog’s allotment, recompute the math — but below it, Datadog often wins, contrary to intuition).
- Distributed multi-service stack (EKS, Lambda, ECS) where correlating logs/traces/metrics on one screen produces a measurable MTTR improvement — Datadog’s real ROI is almost never the price tag, it’s the engineering time saved during incidents.
- Need for unified dashboards across multiple providers beyond AWS (third-party SaaS, residual on-prem).
- A small SRE/Ops team (2-4 people) without the bandwidth to manually operate the CloudWatch ecosystem (Logs Insights, Contributor Insights, Application Signals, X-Ray) and who prefers a packaged UX.
- You’ve already audited your tag cardinality and know your volume will stay predictable — without that audit, the risk of a contractual overshoot on indexing is real on both sides.
Our take
The real question is almost never “Datadog or CloudWatch” as a single choice — it’s a line-by-line arbitrage: infra monitoring, logs, APM and alerting each have their own tipping point, and bundling them into one “let’s take Datadog” or “let’s stay 100% AWS” decision loses money in one direction or the other. Many of the organizations we audit have either over-subscribed a Datadog Enterprise plan for Pro-level needs, or accumulated high-resolution CloudWatch alarms that a standard tier would have covered just fine. A DevSecOps audit or FinOps review walks through this line by line against your actual volume before you sign — or resign — an annual contract.
Conclusion
CloudWatch and Datadog don’t compare on a single number. On a lightly instrumented stack, CloudWatch wins clearly. On a stack with medium-to-high custom-metric density, Datadog’s per-host allotment can flip the result on the infrastructure-monitoring line — APM, on the other hand, stays structurally the priciest line at Datadog once compared against a well-sized Application Signals setup. The only reliable method is to recompute both price lists against your exact volume, line by line, before renewing or cancelling anything.
Sources: Amazon CloudWatch pricing, Datadog pricing, Datadog documentation — custom metrics billing, AWS What’s New — CloudWatch Logs Infrequent Access log class.
Found this useful? Share it.
Go further
A topic, a project, a question?
Distribuée supports demanding SMBs on cloud security, CI/CD supply chain and AI security.
Book 15 min