FinOps
Datadog bill spiraling out of control? The concrete levers on logs, metrics and APM
Over-indexed logs, uncontrolled metric cardinality, APM enabled everywhere: the three line items that blow up Datadog bills, and the Terraform levers to rein them in without losing visibility.
The scenario repeats itself in nearly every FinOps audit we run: Datadog gets enabled on two or three hosts for a one-off need, the team loves the tool, instrumentation spreads service by service — and twelve months later the renewal invoice lands at 2 to 3 times the original budget. Nobody lied about the server count. What actually drifted is what happens between the servers and the bill: how many logs get indexed instead of just ingested, how many tag combinations spawn custom metrics, and on how many hosts APM is genuinely earning its keep.
This isn’t a “should you leave Datadog” article — we already covered that trade-off against CloudWatch in our dedicated comparison. This is for teams keeping Datadog (often rightly so) who want to regain control of the bill without losing operational visibility.
Where the money actually goes
Three line items concentrate almost all the overspend, in this order of frequency:
- Log indexing. Ingestion costs $0.10/GB — cheap, and effectively a safety net. Indexing costs $1.70 per million events on annual commitment ($2.55 on-demand) at 15-day retention. The trap: by default, everything ingested gets indexed. A team shipping raw application logs unfiltered indexes
DEBUGlines and health-check heartbeats at the same rate as its 500 errors. - Custom metric cardinality. The Pro plan includes 100 custom metrics per host — generous on paper. But a Datadog metric is defined by the combination of name + tag values. Adding a
customer_id,request_idorpod_nametag to an existing metric can blow it up into thousands of billable series without anyone adding a single server. - APM enabled by reflex. At $31/host/month (infra bundled, base plan), APM is the most expensive line item per host. Many teams flip it on across the entire fleet “just in case,” including batch workers and staging instances that never generate an incident requiring distributed tracing.
Lever 1 — Ingest wide, index narrow
The right move isn’t cutting ingestion (it’s already cheap and acts as an incident safety net) — it’s decoupling ingestion from indexing with exclusion filters on each log index:
resource "datadog_logs_index" "app_logs" {
  name = "app-logs"

  filter {
    query = "service:api OR service:worker"
  }

  exclusion_filter {
    name       = "drop-debug-and-healthchecks"
    is_enabled = true
    filter {
      query       = "status:debug OR http.url_details.path:/healthz"
      sample_rate = 0.0
    }
  }

  exclusion_filter {
    name       = "sample-info-logs"
    is_enabled = true
    filter {
      query       = "status:info"
      sample_rate = 0.1
    }
  }
}
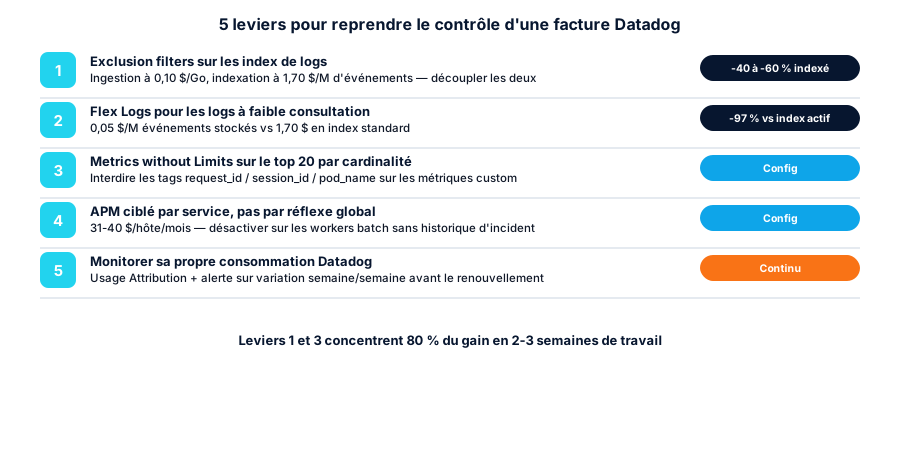
Logs excluded from the index still exist in Live Tail and in the S3 archive — you lose nothing for a post-mortem, you just stop paying to index them. For compliance or audit logs that need to stay searchable without continuous indexing, route them to Flex Logs ($0.05 per million events stored/month, annual commit) instead of the standard index at $1.70 — roughly a 97% gap on storage for low-query-frequency logs.
On a stack that currently indexes 100% of its raw logs, a first pass of exclusion filters on debug/info levels and health-check endpoints typically cuts indexed volume by 40-60% — without touching a single existing dashboard, since queries on the remaining indexed fields keep working as before.
Lever 2 — Take back control of metric cardinality
Metrics without Limits lets you define, metric by metric, which tags are actually indexed for querying — without changing what the agent ingests:
resource "datadog_metric_tag_configuration" "checkout_latency" {
  metric_name = "app.checkout.latency"
  metric_type = "distribution"
  tags        = ["env", "service", "region"]

  # explicitly excludes high-cardinality tags like
  # customer_id, request_id, pod_name from billable series
}
Before configuring anything, the audit that pays off fastest: sort custom metrics by distinct tag count in the Datadog metrics explorer (Metrics > Summary, sorted by “% used” and cardinality). In most audits, 10 to 15 metrics account for 70-80% of billable cardinality — tackling that top 15 before a blanket metric-by-metric audit gives the best effort-to-gain ratio.
Two instrumentation habits worth enforcing upfront with product teams, rather than cleaning up after the fact:
- Never tag a custom metric with
request_id,session_id,user_idorpod_name— those unique identifiers belong on logs and traces, not metrics. - Histograms and distributions each count as 5 custom metrics per tag combination — reserve them for measurements where the full distribution (p50/p90/p99) actually adds value, not by default on every latency measurement.
Lever 3 — Sample APM by service, not by reflex
APM shouldn’t be switched off wholesale — it should be targeted. Two distinct settings, not to be confused:
- Ingestion sampling, on the agent or tracer side (
DD_APM_MAX_TPS/dd-tracesampling rules), decides how many traces are generated at the source. Lowering the ingestion rate cuts the bill but risks missing a rare, interesting trace. - Retention filters, on the Datadog UI side, decide how many already-ingested traces get indexed and kept for 15 days. This is the lever to reach for first: keep 100% of error or high-latency traces, and aggressively sample (5-10%) “nominal” traces on high-volume endpoints like health checks or front-end polling.
Concretely, on the $31-40/host/month of APM, the question to ask host by host isn’t “is this host part of prod” but “has this host generated an incident in the last 90 days that would have benefited from distributed tracing.” Across a 20-30 host fleet, it’s common for a quarter to run batch workers or cron jobs that have never needed distributed traces — moving them back to Infra Monitoring only ($15-23/host instead of $31-40) with no real coverage loss.
Lever 4 — Monitor your own Datadog consumption
The common thread across bills that spiral: nobody watches Datadog usage with Datadog. The /api/v2/usage/hourly_usage API and the native Usage Attribution dashboards expose consumption by org unit, by team (via the team tag) and by product — log ingestion, APM hosts, active custom metrics. A simple monitor on the week-over-week variation of these usage metrics catches a cardinality spike within days rather than at the monthly invoice:
resource "datadog_monitor" "custom_metrics_spike" {
  name    = "Datadog usage - custom metrics ingested spike"
  type    = "metric alert"
  query   = "pct_change(avg(last_1w),last_1w):avg:datadog.estimated_usage.metrics.custom{*} > 0.3"
  message = "Custom metrics ingested up >30% week over week — check a recent deploy or a high-cardinality tag. @slack-finops"

  monitor_thresholds {
    critical = 0.3
  }
}
This monitor costs one standard alert and avoids discovering a cardinality spike at contract renewal — exactly the moment negotiating leverage is weakest.
The three-pass audit method
- Week 1 — map without cutting anything. Usage Attribution by team/service, top 20 metrics by cardinality, ingested-vs-indexed log ratio per index, list of APM hosts with their last traced incident.
- Week 2 — fix the top 20%. Exclusion filters on the largest indexes, tag configuration on the costliest metrics, APM disabled on hosts with no incident history. This is where 80% of the gain lives.
- Week 3 — instrument the governance. Monitors on Datadog’s own usage metrics, a quarterly review timed to the contract renewal cycle, a documented instrumentation rule (forbidden tags on custom metrics) rolled out to product teams.
Our take
The reflex to “negotiate a volume discount at renewal” treats the symptom, not the cause — a 15-20% discount on a poorly controlled volume still costs more than a cleaned-up volume without any discount. The FinOps audits we run on Datadog stacks almost systematically find a 30-50% gain on the logs and custom metrics line items within 2-3 weeks of work, without degrading operational visibility — because most of the trimmed data was never being queried anyway. A targeted DevSecOps audit or FinOps review sorts this out line by line on your actual volume, ideally before the renewal date rather than after signing.
Conclusion
A spiraling Datadog bill is almost never a server-count problem — it’s a problem of unfiltered log indexing, undisciplined metric tagging, and APM enabled by default rather than by need. All three levers configure in Terraform, deploy without service interruption, and the first pass (exclusion filters + tag configuration on the top 20 metrics) fits in a single sprint. The ongoing governance piece — a monitor on your own Datadog consumption — is what keeps you from redoing this audit next year.
Sources: Datadog pricing, Datadog docs — Metrics without Limits, Datadog docs — log index exclusion filters, Datadog docs — Flex Logs, Datadog docs — Usage Attribution, terraform-provider-datadog — datadog_logs_index.
Found this useful? Share it.
Go further
A topic, a project, a question?
Distribuée supports demanding SMBs on cloud security, CI/CD supply chain and AI security.
Book 15 min